
How Much Snow Does Your State Get? See the 50-State Map

A few inches can define an entire winter in one place. Somewhere else, that much snow barely interrupts the morning commute.
Our average annual snowfall map puts those differences in view. Vermont leads this particular comparison at 95.8 inches a year—nearly eight feet—with Maine and New Hampshire next.
What the map measures: These are averages across sampled locations within each state, compiled by PlainClimate from NOAA’s 1991–2020 climate normals. They are not official area-weighted statewide averages or predictions for the coming winter.
Average Annual Snowfall by State
Find your state below. All figures are in inches per year and match the map.
| State | Annual snowfall (inches) |
|---|---|
| Alabama | 0.7 |
| Alaska | 80.5 |
| Arizona | 9.2 |
| Arkansas | 3.1 |
| California | 13.2 |
| Colorado | 61.7 |
| Connecticut | 43.5 |
| Delaware | 13.7 |
| Florida | 0.0 |
| Georgia | 0.7 |
| Hawaii | 0.0 |
| Idaho | 44.6 |
| Illinois | 21.3 |
| Indiana | 22.6 |
| Iowa | 32.2 |
| Kansas | 15.1 |
| Kentucky | 10.3 |
| Louisiana | 0.2 |
| Maine | 86.9 |
| Maryland | 24.7 |
| Massachusetts | 48.7 |
| Michigan | 76.8 |
| Minnesota | 49.6 |
| Mississippi | 0.7 |
| Missouri | 11.6 |
| Montana | 51.1 |
| Nebraska | 29.5 |
| Nevada | 20.9 |
| New Hampshire | 83.2 |
| New Jersey | 21.7 |
| New Mexico | 20.5 |
| New York | 80.4 |
| North Carolina | 6.9 |
| North Dakota | 43.4 |
| Ohio | 28.7 |
| Oklahoma | 6.2 |
| Oregon | 27.4 |
| Pennsylvania | 44.1 |
| Rhode Island | 40.8 |
| South Carolina | 1.1 |
| South Dakota | 44.2 |
| Tennessee | 4.9 |
| Texas | 2.1 |
| Utah | 45.9 |
| Vermont | 95.8 |
| Virginia | 14.3 |
| Washington | 28.4 |
| West Virginia | 41.8 |
| Wisconsin | 50.8 |
| Wyoming | 58.7 |
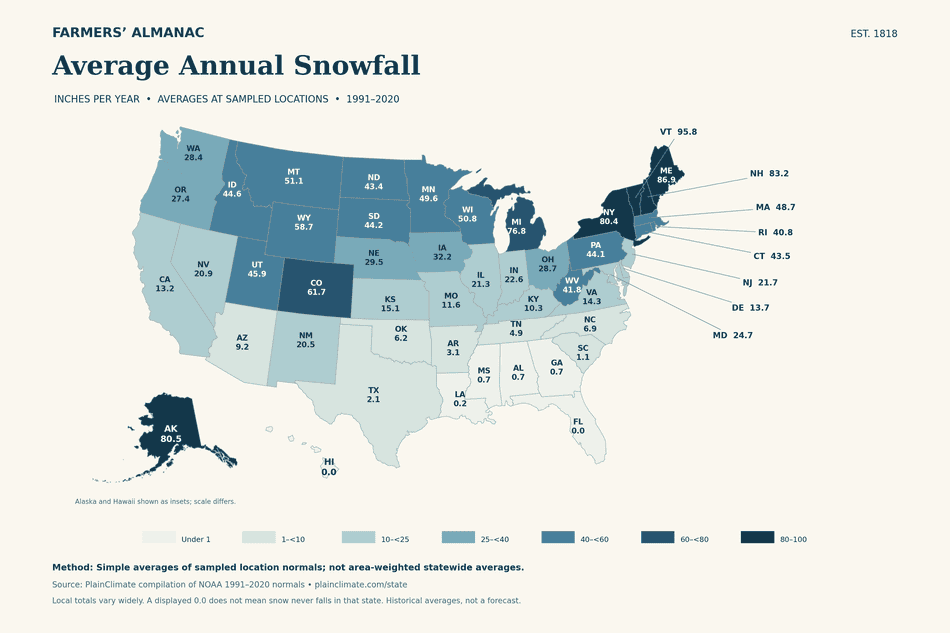
Source: PlainClimate state comparison. A displayed 0.0 describes the dataset; it does not establish that snow never occurs anywhere in that state.
Why Your Town May Get More or Less Snow
If your state’s number looks nothing like the winter outside your window, that is a useful reminder of what a broad average leaves out. A state boundary can contain mountain summits, sheltered valleys, lakeshores, and coastal communities.
Mountains can help produce more precipitation
When moist air encounters a mountain, it can be forced upward. As it rises, it cools, helping produce clouds and precipitation. The National Weather Service calls this orographic uplift. When conditions are cold enough, that precipitation falls as snow.
That is one reason a single state figure cannot describe every elevation. A mountain snowfall total and a nearby valley total answer different questions, even when both locations share the same state.
The Great Lakes create local snow belts
According to NOAA’s lake-effect snow explainer, cold air crossing relatively warm lake water can take up heat and moisture, producing snow downwind.
These snow bands help explain why snowfall can change dramatically over a short distance. Wind direction matters: it helps determine which communities lie beneath a band and which miss it. Read more about what causes lake-effect snow.
How These Snowfall Averages Were Calculated
PlainClimate’s methodology starts with NOAA climate normals and organizes weather stations into named locations. Those locations include towns, airports, and other observation sites. Its state comparisons use simple averages across station-mapped locations rather than weighting every square mile equally.
For an illustration, imagine three sampled locations averaging 10, 20, and 90 inches annually. Their simple average is 40 inches. That calculation does not tell us how much of the state experiences each amount.
Where stations are located therefore matters. A comparison emphasizing mountain locations can look different from one emphasizing lower-elevation communities. The source also does not clearly explain its treatment of missing snowfall values in the state calculation.
Use this map as a broad comparison of sampled locations, not a precise snowfall expectation for your address.
Find the Average Snowfall Near Your Home
For a more local answer, use NOAA’s U.S. Climate Normals tool. Select the 1991–2020 period and look for a nearby station with snowfall records.
Consider its setting as well as its distance from you. A station across a mountain ridge or beside a large lake may experience different conditions. Comparing several nearby stations can provide more context than relying on one state number.
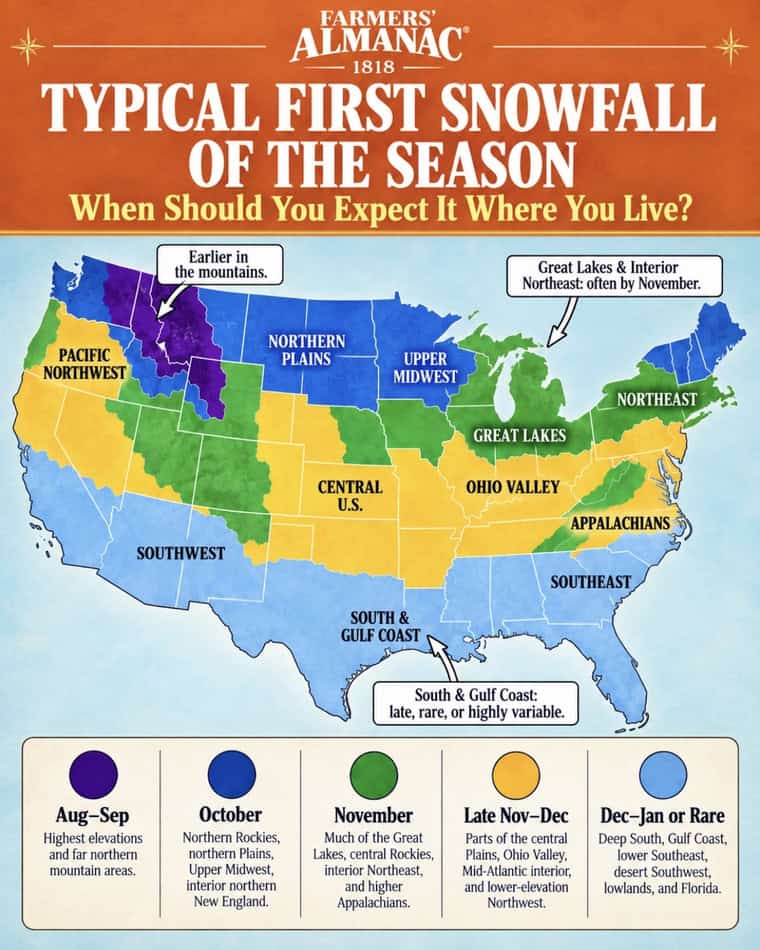
If you are wondering when flakes might first arrive, see our guide to when to expect your first snowfall.
Does This Map Predict Snow for Winter 2026–2027?
No. Climate averages describe a historical baseline. They do not tell us how much snow will fall during one particular winter, when storms will arrive, or how long snow will remain on the ground.
For our seasonal outlook, visit the Farmers’ Almanac 2026–2027 Winter Weather Forecast. For approaching storms, check your local National Weather Service forecast.
Does the number on the map look close to winters where you live? Tell us your town and state—and whether you usually see more or less snow.


- Farmers' Almanac Staff

- Farmers' Almanac Staff
- Farmers' Almanac Staff
- Farmers' Almanac Staff