How Doppler Radar Works: Storm Detection in Plain English
Quick Reference
- What it is: a radio-wave detection system that bounces short pulses off raindrops, hail, and snowflakes, then reads the returning signals to map precipitation.
- The Doppler part: measures the wind speed inside a storm by tracking how the returning signal’s frequency shifts when raindrops move toward or away from the radar.
- U.S. system: NEXRAD (WSR-88D), a network of 159 Doppler radars across the U.S., the Caribbean, and U.S. territories, run jointly by the National Weather Service, FAA, and Air Force.
- Range: roughly 250 miles for precipitation detection, less for fine wind-shift detail. Earth’s curvature limits the lower-altitude view past the 250-mile mark.
- Killer feature: the hook echo. A J-shaped reflectivity signature that often appears 15 to 30 minutes before a tornado touches down. Has saved thousands of lives since the late 1950s.
Doppler radar is the reason a tornado warning gets to your phone 15 minutes before the funnel touches down. It is the reason your meteorologist can show a hurricane wrapping around its eye before the first rain band hits the coast. It is the reason a hail core inside a thunderstorm can be sized accurately before the stones start falling. The technology is roughly 80 years old, the U.S. national network is a half-century old, and the difference between weather forecasting before and after Doppler radar is the difference between hoping and knowing. Here is how it works, what the radar screen is actually showing you, and how to read the most important shapes that appear on it.
What Radar Actually Does
Radar is short for “radio detection and ranging.” A radar transmitter emits a narrow beam of short radio-wave pulses into the sky. The pulses travel outward at the speed of light. Anything in the beam’s path that is large enough and dense enough (a raindrop, a hailstone, a snowflake, a flock of birds, an aircraft) reflects part of the signal back to the antenna. Between pulses, the antenna listens for those returning echoes. By measuring the time between the outgoing pulse and the returning echo, the radar can calculate exactly how far away the reflecting object is. By rotating the antenna, the radar maps everything in the sky around its location.
The strength of the returning signal tells the radar how much there is to reflect. A heavy rain core produces a strong echo. A light drizzle produces a weak one. Hail produces an unusually strong echo because hailstones are dense and round, which makes them efficient reflectors. The radar processes these signals into the colored maps you see on TV: blue for light precipitation, green for moderate, yellow for heavy, red and purple for extreme rain or hail.
From Battlefield to Forecast Tool
Radar started as a military technology. German physicist Heinrich Hertz demonstrated in the 1880s that radio waves could be reflected by metallic surfaces, the underlying principle. Christian Hulsmeyer patented the first radio-wave detection device in 1904, marketed to ships as collision-avoidance gear. The technology stayed niche until the 1930s, when the British developed the first practical radar systems for early-warning detection of incoming aircraft. By the time WWII arrived, both Allied and Axis powers had operational radar networks tracking warplanes, ships, and submarines.
Wartime radar operators noticed an annoying side effect: rain showed up on the screen and partially obscured the targets they were trying to see. After the war ended, that “annoying side effect” became a research opportunity. By the late 1940s, the U.S. Weather Bureau (forerunner of the National Weather Service) had begun using radar to track precipitation. The first national U.S. weather radar network, the WSR-57, came online in 1957. It was a 1950s vacuum-tube system, originally authorized by Congress in response to a string of disastrous Atlantic hurricanes in 1954-1955. By the mid-1980s the WSR-57s were obsolete, and the WSR-88D Doppler system (NEXRAD) replaced them in a national rollout that ran from 1988 through the late 1990s.

The Doppler Effect, in One Image
The “Doppler” in Doppler radar refers to a 1842 discovery by Austrian physicist Christian Doppler, who showed that the frequency of a wave shifts when its source is moving relative to the observer. The everyday example is the police siren. As the cruiser approaches, the siren sounds higher-pitched. As it passes, the pitch drops noticeably. Same siren, same physical sound, but the frequency you hear shifts because the distance between you and the source is changing.
Doppler radar applies the same principle to radio waves and raindrops. When a raindrop is moving toward the radar, the returning echo’s frequency is slightly higher than the outgoing pulse. When it is moving away, the frequency is slightly lower. The radar measures that frequency shift and converts it into a wind-speed reading: positive (toward the radar), negative (away from the radar), and the magnitude in mph or knots. This is the part that distinguishes Doppler radar from older radar systems. A WSR-57 could tell you where the rain was. A WSR-88D Doppler can tell you where the rain is and how fast the wind is moving inside it.
Two Maps from One Radar: Reflectivity and Velocity
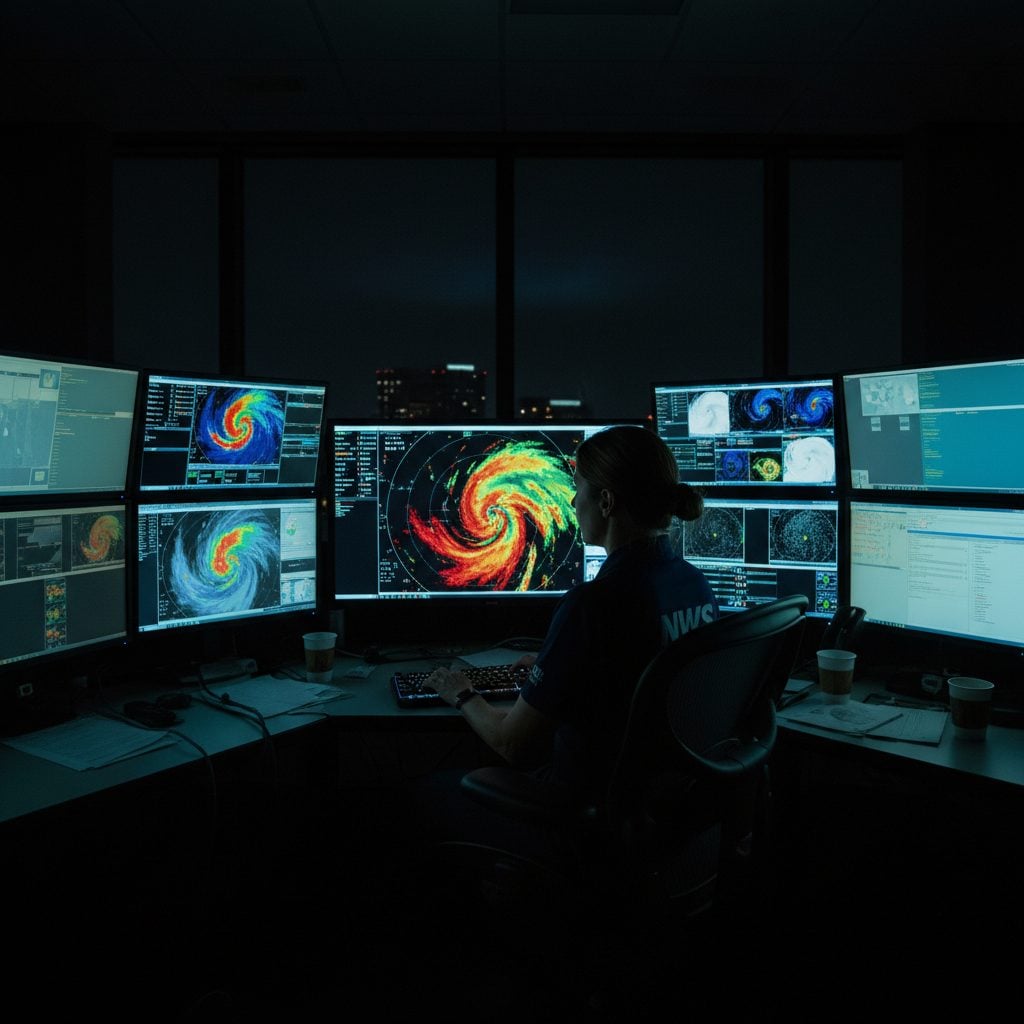
A modern Doppler radar produces two distinct maps from each scan, and reading both is what makes a meteorologist a meteorologist rather than a TV weather presenter.
- Reflectivity map: the familiar blue-green-yellow-red precipitation map. Shows where the precipitation is and how heavy. This is what most TV weather segments use.
- Velocity map: a two-color map (typically red for “moving away from radar,” green for “moving toward radar”) that shows wind direction and speed inside the precipitation. The interesting feature is the boundary, where adjacent red and green pixels indicate strong rotation.
Tornadoes appear most clearly on the velocity map. A tight pocket of high-magnitude red pixels next to a tight pocket of high-magnitude green pixels (a “couplet”) means a small region where wind is moving rapidly in opposite directions, which is the signature of a rotating column of air. When that signature appears within the reflectivity hook of a supercell thunderstorm, the National Weather Service knows a tornado is forming, and the warning goes out.
Hook Echoes and Tornado Detection
The hook echo is one of the most consequential discoveries in 20th-century meteorology. In April 1953, meteorologist Edward M. Brooks at the Illinois State Water Survey was reviewing radar imagery from a storm that had produced a tornado the previous afternoon. He noticed a small, J-shaped curl on the southwestern edge of the storm’s reflectivity image (a hook off the main precipitation core that bent inward). The hook had appeared roughly 30 minutes before the tornado touched down.
The pattern repeated across other tornado events. Within a few years, meteorologists confirmed that a hook echo on radar reflectivity was strongly associated with the rotating mesocyclone of a supercell thunderstorm, the storm structure most likely to produce a tornado. Not every hook produces a tornado, and not every tornado produces a clean hook, but the correlation is strong enough that the appearance of a hook on radar triggers immediate attention from the local NWS office. The lead time the hook provides (typically 15 to 30 minutes) is what makes a modern tornado warning useful. Before radar, a tornado was a sky-darkening surprise. After radar, the warning beats the funnel.
NEXRAD: The U.S. National Doppler Network
NEXRAD (Next-Generation Radar) is the U.S. operational Doppler weather radar network. The full system includes 159 individual Doppler radars (the WSR-88D model) covering the contiguous U.S., Alaska, Hawaii, Puerto Rico, Guam, Okinawa, and South Korea. The network is jointly operated by the National Weather Service, the Federal Aviation Administration, and the U.S. Air Force, with each agency using the data for its own forecasting and operational needs.
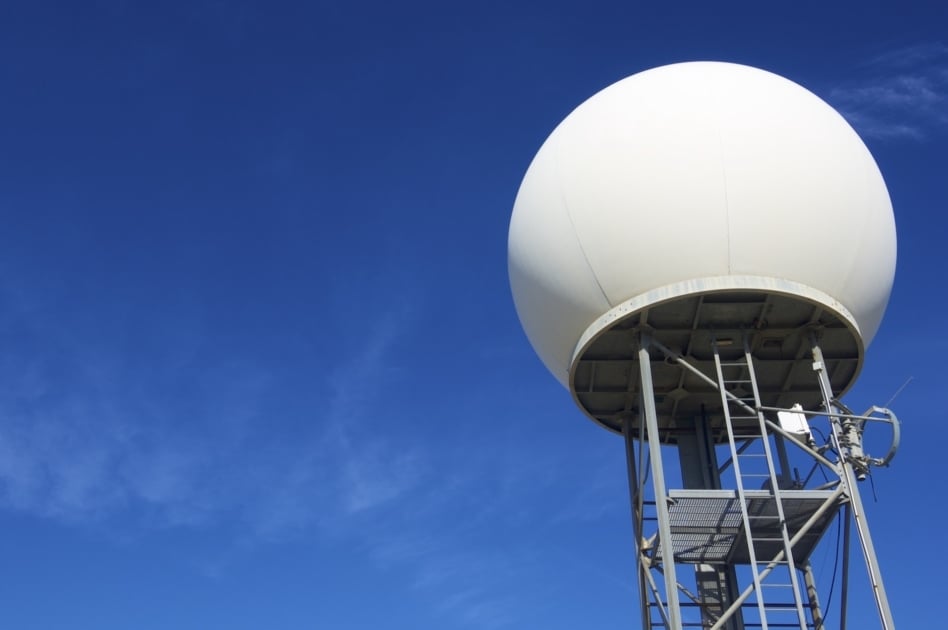
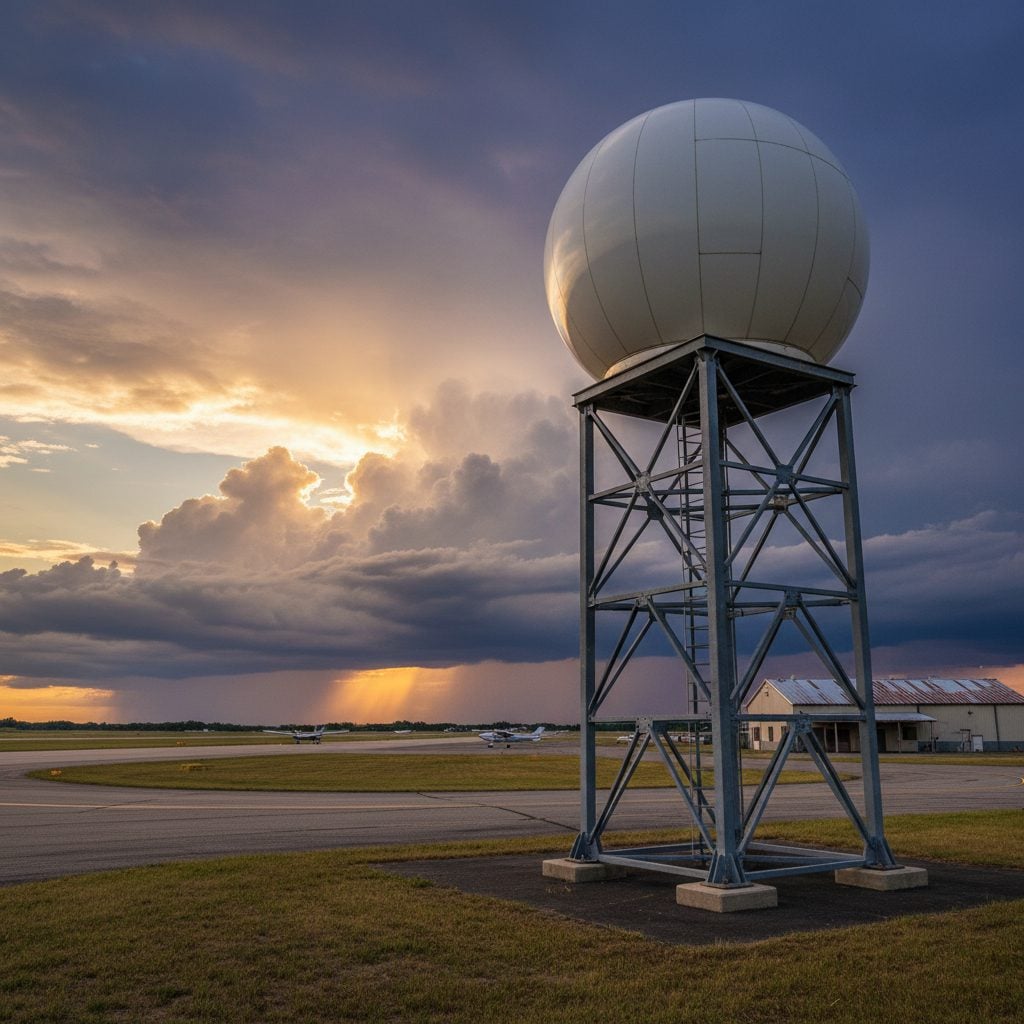
Each WSR-88D antenna is housed in a white spherical “radome” perched on a tower, often near a regional airport or on a hilltop with good sky visibility. The antenna inside rotates continuously, completing a full 360-degree sweep every 4 to 6 minutes. It also tilts up and down through about 14 elevation angles, building a three-dimensional volume scan of the atmosphere out to roughly 250 miles in radius and roughly 60,000 feet in altitude. Every 4 to 6 minutes, the radar generates a fresh complete picture of the precipitation and wind patterns within range.
The 159 individual radars overlap their coverage where the population is densest. Most of the contiguous U.S. is within range of two or three NEXRAD sites, which gives meteorologists multiple angles on the same storm and lets them confirm the radar readings. The far Western U.S. (the Great Basin, parts of the desert Southwest) has more coverage gaps because the population is thinner and the terrain blocks more of the lower-altitude view.
Dual-Polarization: The 2013 Upgrade
Between 2011 and 2013, the entire NEXRAD network received an upgrade called dual-polarization (or “dual-pol”). The original WSR-88D radars sent out radio pulses with horizontal polarization only. The dual-pol upgrade added vertical polarization, giving the radar two simultaneous views of every target. The benefit: the system can now distinguish between rain, snow, hail, sleet, and even non-meteorological targets like flocks of birds or wildfire smoke, by comparing how each target reflects horizontally versus vertically polarized signals.
For tornado detection, dual-pol added a critical feature: the “tornado debris signature” (TDS). When a tornado is on the ground, it lofts debris (boards, insulation, vehicles) into the air. That debris produces a distinctive radar return that dual-pol can identify as solid (not liquid water). The TDS is the radar’s way of confirming that a tornado is actually on the ground producing damage, as opposed to a strong rotation aloft that has not yet touched down. Combined with the hook echo and velocity couplet, the TDS gives forecasters three independent radar signals to confirm a tornado in real time.
What Doppler Radar Cannot See
Doppler radar has limits, and reading the radar is partly about knowing where those limits are.
- Earth curvature: beyond about 250 miles, the radar beam is too high above the ground to detect surface-level precipitation. The horizon hides the lower atmosphere.
- Beam blockage: mountains, tall buildings, and even tall trees can block portions of the radar’s view. The Western U.S. has more blockage issues than the East, which is why NEXRAD coverage is patchier west of the Rockies.
- Clear-air conditions: when there is no precipitation in the air, the radar shows mostly empty sky. Some clear-air returns from insects, birds, and dust still appear, but a clear-air radar image is mostly noise.
- Microbursts before they hit: the strong sinking column of air in a microburst is hard to see on radar before it reaches the ground. The Doppler velocity does pick up the divergence at the surface, but the lead time is shorter than for tornadoes (sometimes only 1 to 3 minutes). For more on microbursts, see our microburst piece.
- Tornadoes inside heavy rain: when a tornado is wrapped in rain, the precipitation can mask the velocity signal. “Rain-wrapped” tornadoes are unusually dangerous because the visual cues are gone and the radar detection is harder.
The radar is one input. Storm spotters, satellite imagery, lightning networks, and surface observations are the others. A modern severe-weather forecast is built from all of them together, with the radar providing the highest-resolution picture of what is happening right now.
How to Read a Radar Image Yourself
The radar imagery on weather apps and TV is the same data the National Weather Service forecasters see, just simplified for the screen. A few things to look for:
- Color intensity: red and purple usually mean very heavy rain or hail. Yellow and orange are heavy. Green is moderate. Blue is light.
- Storm motion: most TV apps show storm motion arrows. The arrow shows where the storm cell is heading and how fast.
- Hook echo: a J-shape curling off the southwestern edge of a heavy storm cell. Take cover.
- Bow echo: a curved line of storms shaped like a bow, often associated with damaging straight-line winds.
- Squall line: a long, narrow line of storms moving as a unit. Tornadoes are less likely than in supercells but straight-line wind damage is common.
For most U.S. residents, the National Weather Service public radar viewer (radar.weather.gov) is the authoritative source for the same NEXRAD data your local TV meteorologist is using. Many smartphone weather apps pull from the same feed. Both update every 4 to 6 minutes during active weather.
What Comes After NEXRAD
The NEXRAD WSR-88D system is now over 30 years old (2026), and the National Weather Service has begun planning a successor. The leading concept is “phased array radar,” which uses thousands of small fixed transmitters instead of one rotating antenna. A phased array can scan the full sky in 30 to 60 seconds rather than 4 to 6 minutes, which would reduce the gap between scans and shorten the time it takes to confirm a tornado in formation. A few experimental phased-array units are already in operation at NWS test sites.
For most users, the rollout will be invisible. The radar imagery on weather apps will continue to look the same. The forecasts will arrive faster, the warnings will arrive earlier, and the lead time on the most dangerous storms will keep getting longer. The 30-minute hook-echo lead time of the 1980s is now closer to 15 minutes for tornado warnings (because forecasters wait for confirmation before issuing). Phased array could push that back toward 30 minutes again, with higher confidence.
For more on the science behind the imagery, the National Weather Service’s JetStream education site has a complete Doppler radar primer that walks through the technology in more detail. For the long-range outlook that pairs with the real-time radar picture, the Farmers’ Almanac long-range forecast covers the seasonal patterns that produce the storms the radar tracks.
Doppler radar is the difference between guessing and seeing. For more on the storm types radar tracks, see our scuds and gustnadoes piece. The next time the local TV station drops the rectangle of color over your county, you are looking at the same picture the National Weather Service forecaster sees, built from radio pulses bouncing off the rain at 250 miles a sweep. It is the most useful 80-year-old technology in modern weather.

Frequently Asked Questions
What is the difference between regular radar and Doppler radar?
Regular radar tells you where the precipitation is and how heavy. Doppler radar adds wind-speed measurement: it tracks how the returning signal’s frequency shifts to determine how fast the rain is moving toward or away from the radar, which lets meteorologists see the wind structure inside a storm.
How far can Doppler radar see?
Roughly 250 miles for precipitation detection. Beyond that, Earth’s curvature puts the radar beam too high above the ground to see surface-level weather. Higher in the atmosphere, the range is longer; the 250-mile figure refers to surface and near-surface coverage.
What is a hook echo?
A J-shaped reflectivity signature that appears on the southwestern edge of a supercell thunderstorm. The hook is associated with the rotating mesocyclone that often produces tornadoes. When forecasters see a hook echo, the National Weather Service typically issues a tornado warning within minutes.
Can Doppler radar see tornadoes?
Yes, indirectly. The radar detects the rotation that produces tornadoes through the Doppler velocity map (a “couplet” of opposing wind directions). After the dual-polarization upgrade in 2013, radars can also detect the debris a tornado lofts into the air, which confirms a tornado is on the ground producing damage.
How often does the radar update?
Every 4 to 6 minutes for a complete volume scan during active weather. The newer phased-array radar concepts under development could reduce this to 30 to 60 seconds.
What does dual-polarization radar add?
Dual-polarization (rolled out across NEXRAD between 2011 and 2013) adds a second pulse polarization to every scan, allowing the radar to distinguish rain from snow from hail from non-meteorological targets like birds or smoke. It also enables tornado debris signature detection, which confirms a tornado is on the ground.
Where can I view real-time radar?
The National Weather Service public radar viewer at radar.weather.gov is the authoritative free source for NEXRAD data. Most weather apps pull from the same feed. Both update every 4 to 6 minutes during active weather.


Joe Rao
Joe Rao is an esteemed astronomer who writes for Space.com, Sky & Telescope, and Natural History Magazine. Mr. Rao is a regular contributor to the Farmers' Almanacand serves as an associate lecturer for the Hayden Planetarium in New York City.
- Joe Rao

- Joe Rao
- Joe Rao
- Joe Rao