What Is El Nino? How the Pacific Pattern Shapes U.S. Weather
Forecasters say another El Nino may be forming. But what is it, and how does it affect our weather patterns? We explain.
Quick Reference
- What it is: a band of unusually warm sea-surface water along the equatorial Pacific, which shifts global atmospheric circulation and rewrites U.S. winter weather.
- How often: El Nino events occur every 3 to 7 years, typically lasting 9 to 18 months. They are part of a back-and-forth pattern with La Nina, called the El Nino Southern Oscillation (ENSO).
- U.S. winter signature: warmer and drier than average across the northern tier (Pacific Northwest, Upper Midwest, Northeast, much of Canada). Cooler and wetter than average across the southern tier (California, Gulf Coast, Florida).
- Current status (April 2026): ENSO-neutral, transitioning toward El Nino. NOAA’s Climate Prediction Center gives a 61% chance of El Nino emerging in May-July 2026 and persisting through the rest of 2026.
- Last El Nino: June 2023 through April 2025, a moderate-to-strong event with significant California flooding, a quiet Atlantic hurricane season in 2023, and warmer-than-average winters across the northern U.S.
El Nino is one of the few climate signals strong enough that a single phrase changes how forecasters write the seasonal outlook for the entire U.S. The name has been in the meteorological vocabulary for over a century, but the science of what it actually does (the chain that runs from a warming of the equatorial Pacific through the global atmospheric circulation and into the winter weather over Boise and Boston) is more recent. Here is what El Nino is, how it shifts the jet stream, what it has done in past events, and where the current cycle stands as of spring 2026.
What El Nino Actually Is
El Nino is a sustained warming of sea-surface temperatures across the central and eastern equatorial Pacific Ocean, generally measured in a region called the Nino 3.4 box (between 5 degrees North and 5 degrees South latitude, between 170 and 120 degrees West longitude, roughly the Pacific west of Peru and Ecuador). When the Nino 3.4 sea-surface temperature runs more than 0.5 degrees C above the long-term average for three consecutive months, the National Oceanic and Atmospheric Administration declares El Nino conditions. When that warm anomaly persists for five overlapping three-month periods, the event is officially classified as an El Nino.
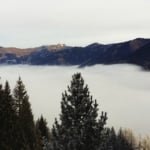
The warm water itself is only the surface signal. What makes El Nino consequential is the way that surface warming reorganizes the entire equatorial Pacific atmosphere. Normally, easterly trade winds push warm surface water westward across the Pacific, piling it up near Indonesia and Australia where it produces heavy rainfall. During an El Nino, those trade winds slacken or reverse. The warm water and the rainfall it drives slosh eastward, displacing the typical Pacific atmospheric circulation. That displacement ripples outward through the jet stream and changes weather patterns across North America, South America, Africa, and Asia.
Where the Name Comes From
The name comes from Peruvian fishermen in the 1800s. Every few years, around Christmastime, the cold, fish-rich Humboldt Current along the Peruvian coast would shift south, replaced by warmer, less productive water. The fishermen called the warm current “El Nino” (Spanish for “the little boy” or, more specifically, “the Christ Child,” because of the Christmas timing). The name stuck. By the early 20th century, scientists studying global weather patterns had connected the Peruvian coastal warming to broader Pacific anomalies, and by the 1960s the connection between equatorial Pacific warming and global weather impacts (called “teleconnections”) had been formally documented.
The “Southern Oscillation” half of the name ENSO comes from the work of British mathematician Sir Gilbert Walker in the 1920s and 1930s. Walker noticed that air pressure across the tropical Pacific oscillated between the Indonesian zone and the Tahitian zone in a pattern that took several years per cycle. He called the pattern the Southern Oscillation. The connection between Walker’s pressure oscillation (high pressure in one zone meant low pressure in the other) and the El Nino sea-surface warming was made formal in the 1960s by Norwegian-American meteorologist Jacob Bjerknes, and the combined name “El Nino Southern Oscillation” (ENSO) followed.

A Normal Year vs. an El Nino Year
The clearest way to understand what El Nino does is to compare a typical year with an El Nino year. In a typical (non-ENSO) year:
- Easterly trade winds push warm surface water westward across the Pacific, piling it up against the western Pacific (Indonesia, Australia, Philippines).
- Cold deep water rises along the eastern Pacific (Peruvian coast) to replace the surface water that has been pushed west, producing the cold, fish-rich Humboldt Current.
- Heavy rainfall concentrates over the warm western Pacific, releasing latent heat that drives the local atmospheric circulation.
- The polar jet stream over North America runs in a relatively flat west-to-east pattern, with seasonal weather following its typical regional climatology.
In an El Nino year:
- Trade winds weaken, sometimes reverse. Warm surface water sloshes eastward, no longer piled in the western Pacific.
- The cold Humboldt upwelling along the Peruvian coast slows or stops, replaced by warmer, less productive water.
- Heavy rainfall shifts eastward across the equatorial Pacific, leaving Indonesia and Australia in drought conditions and producing heavy rain in places that are usually drier (eastern Pacific islands, parts of South America).
- The polar jet stream develops a deeper southerly dip across the eastern Pacific and southwestern U.S., steering Pacific storms across central California, the Southwest, and the Gulf Coast in winter.
- The northern jet stream, which normally delivers winter cold to the U.S. northern tier, weakens or shifts northward, leaving New England, the Upper Midwest, and the northern Plains warmer and drier than average.
The shift produces winners and losers. California reservoirs fill faster during El Nino winters than during La Nina ones. Gulf Coast and Southeast farmers see more frequent winter storms. Northeast utilities see lower natural-gas demand because the winters run milder. Atlantic hurricane seasons run quieter (because the same upper-level conditions that produce more Pacific storms produce more wind shear over the tropical Atlantic, suppressing hurricane formation). The total effect is significant; the strongest El Nino events have produced billions of dollars of weather-related damages and savings simultaneously, depending on which region you measure.
El Nino Strength: Weak, Moderate, Strong, Very Strong
NOAA classifies El Nino events by the peak Nino 3.4 sea-surface temperature anomaly during the event:
- Weak: peak anomaly +0.5 to +0.9 degrees C. The U.S. weather impact is mild and sometimes not clearly distinguishable from neutral conditions.
- Moderate: peak anomaly +1.0 to +1.4 degrees C. Clear U.S. winter signal: wetter and cooler in the southern tier, warmer and drier in the northern tier.
- Strong: peak anomaly +1.5 to +1.9 degrees C. Pronounced U.S. winter signal, often with significant California rainfall and major drought relief in the Southwest.
- Very strong: peak anomaly +2.0 degrees C and above. Major global impacts. Recent very-strong events: 1982-1983, 1997-1998, 2015-2016. Each produced billions of dollars in weather-related damages and was followed by a strong La Nina.
Strength matters. A weak El Nino may not produce a noticeable U.S. winter signal at all; a very strong El Nino can dominate the entire winter forecast. The 2015-2016 event, the strongest on record (peaking near +2.6 degrees C), produced California’s wettest winter in five years, broke a five-year California drought, and contributed to the most active global typhoon and hurricane season in modern record.
A History of Recent El Ninos
El Nino has been observed in roughly 30 years since 1950. The most consequential events:
- 1982-1983: the first event monitored in real time by satellite. Caused an estimated $13 billion in global damages, including catastrophic flooding in Peru and Ecuador, drought in Australia, and a notably wet winter in the southern U.S.
- 1997-1998: the strongest event on record at the time. Produced a wet winter in California, a quiet Atlantic hurricane season, and global temperature anomalies that pushed 1998 to the warmest year on record (held until 2014).
- 2009-2010: a moderate event that produced a notably mild U.S. winter. Atlanta and the Southeast saw above-average winter rainfall.
- 2015-2016: the strongest event on the modern record (peak +2.6 degrees C in November 2015). Produced California’s wettest winter in five years, a record-quiet Atlantic hurricane season for that strength range, and global temperature spikes that pushed 2016 to the warmest year on record.
- 2018-2019: a weak-to-moderate event that produced a clear but not dramatic U.S. winter signal.
- 2023-2025: a moderate-to-strong event declared by NOAA in June 2023 and concluded in April 2025. Produced significant California flooding (winter 2023-2024), a quieter-than-expected Atlantic hurricane season in 2023, and warmer-than-average winters across the U.S. northern tier.
El Nino events have ranged in length from 9 months to over 4 years. The longest recorded El Nino ran from spring 1991 through summer 1995, a period marked by repeated weather disasters worldwide.
Where the Current Cycle Stands (April 2026)
As of April 2026, the equatorial Pacific is in an ENSO-neutral state, the brief in-between condition that follows the spring of an El Nino-to-neutral transition. The 2023-2025 El Nino concluded in April 2025, and the Pacific has been in neutral conditions since then. The most recent weekly average of the Nino 3.4 index is around +0.5 degrees C, on the warm side of neutral.
NOAA’s Climate Prediction Center, in its mid-April 2026 ENSO discussion, projected:
- April-June 2026: ENSO-neutral conditions favored (80% chance), with continued slow warming in the Nino 3.4 region.
- May-July 2026: El Nino likely to emerge (61% chance), with the warm anomaly building above the +0.5 degrees C threshold.
- September-November 2026: El Nino conditions strengthening, with model consensus pointing toward at least a moderate event by autumn.
- December 2026 – February 2027: El Nino at peak (88-94% chance per the IRI ENSO plume), influencing the 2026-2027 U.S. winter.
The forecast confidence is moderate-to-high. The “spring predictability barrier” (the phenomenon where ENSO forecasts struggle to be accurate from March through May because the equatorial Pacific is at a transitional state) is the main reason confidence is not higher. After about June, the forecast clarity tends to improve sharply. By the time the Farmers’ Almanac long-range forecast for the 2026-2027 winter is finalized, the ENSO state should be more confidently known.
What an El Nino Means for U.S. Regions
The U.S. winter signal during a moderate-to-strong El Nino is one of the most reliable seasonal forecasts in climate science. The pattern by region:
- Pacific Northwest (Washington, Oregon, Idaho): warmer and drier than average. Snowpack runs below normal. Ski seasons can be poor.
- California: wetter than average, especially central and southern California. Reservoirs and snowpack benefit. Risk of localized flooding rises.
- Southwest (Arizona, New Mexico, Texas Panhandle): wetter than average. Drought relief is the main benefit; high-water risk in flood-prone basins is the main downside.
- Central Plains and Upper Midwest: warmer and drier than average. Reduced snow accumulation and milder winters.
- Southeast (Florida, Georgia, the Carolinas): wetter and cooler than average. Active winter-storm track, with more rain events and occasional severe weather.
- Northeast and New England: warmer and drier than average. Reduced snow totals, especially across upstate New York and Maine. Lower heating-fuel demand.
- Atlantic hurricane season: quieter than average. Increased upper-level wind shear over the tropical Atlantic suppresses hurricane formation and intensification.
- Eastern Pacific hurricane season: more active than average. The same Pacific atmospheric pattern that suppresses Atlantic storms enhances Pacific ones.
For the season-by-season impact on your specific region, the Farmers’ Almanac long-range forecast incorporates the ENSO state into its zone-by-zone outlook. For more on the contrasting La Nina pattern, see our what is La Nina piece. For the science behind the broader ENSO cycle, NOAA’s official El Nino-Southern Oscillation reference covers monthly diagnostic discussions, current Nino 3.4 readings, and historical event archives.
El Nino’s Effects Beyond Weather
For the names already on the rotation for the upcoming Atlantic hurricane seasons, see our hurricane names reference. El Nino is not only a weather story. The cascading effects reach into agriculture, fisheries, energy markets, and public health.
- Fisheries: the Peruvian anchovy fishery, one of the largest in the world, can collapse during a strong El Nino because the cold-water upwelling that sustains it stops. The 1972-1973 event (a moderate El Nino) caused a multi-year collapse of the fishery and a global spike in fishmeal prices.
- Agriculture: Australian and Southeast Asian agriculture (especially wheat, sugar, palm oil) suffer during El Nino events because the rainfall they depend on shifts eastward. Brazilian and Argentine soybean and corn output sometimes benefits.
- Energy markets: warmer U.S. winters during El Nino reduce natural-gas heating demand in the Northeast and Midwest. Hotter U.S. summers during the post-El Nino transition can increase electricity demand for cooling.
- Public health: stronger storms in the southern U.S. and Latin America increase the risk of vector-borne diseases (dengue, malaria) and respiratory illnesses linked to flooding and humidity.
- Coral bleaching: the warmest equatorial Pacific waters during a strong El Nino can produce mass coral-bleaching events that reach far beyond the equator, damaging reefs from the central Pacific to the Caribbean.
The more spread-out the impacts, the more economic value there is in forecasting them well. NOAA, the IRI, and partner institutions worldwide invest substantial resources in ENSO forecasting precisely because the downstream effects (worth tens of billions of dollars annually) reward even modest improvements in lead time and accuracy.
Reading El Nino as One Input
The honest framing for the public reader: El Nino is a strong, broad signal, not a deterministic forecast. A strong El Nino loads the dice toward a wetter California winter and a milder Northeast winter, but the dice still get rolled. Other patterns (the Arctic Oscillation, the Madden-Julian Oscillation, the Pacific Decadal Oscillation) can amplify or partially cancel the ENSO signal in any given month.
Used as one input among several, El Nino is one of the most useful seasonal-forecast variables available. Used as the only input, it can mislead. The Farmers’ Almanac long-range forecast layers the ENSO state with several other climate signals to produce a zone-by-zone outlook. The same logic applies to your own seasonal planning: read the ENSO state, layer it with the long-range forecast, then plan for the consensus rather than any single signal.
El Nino is the Pacific Ocean’s most influential mood. When it shifts, the global atmosphere reorganizes, and the U.S. winter map gets redrawn. As of April 2026, the next shift is in motion. The 2026-2027 winter will look notably different from the past two if the projected El Nino arrives on schedule.

Frequently Asked Questions
When will the next El Nino start?
As of April 2026, NOAA’s Climate Prediction Center gives a 61% chance of El Nino emerging in May-July 2026, strengthening through autumn, and peaking in the December 2026 – February 2027 winter. Forecast confidence will improve after the spring predictability barrier passes in May.
How often does El Nino happen?
Every 3 to 7 years on average, but the timing is irregular. Some El Nino events follow each other within a couple of years; others are separated by longer La Nina or neutral periods.
How long does an El Nino last?
9 to 18 months is typical. The longest recorded El Nino ran from spring 1991 through summer 1995, an unusual extended event with multiple weather disasters worldwide.
What is the difference between El Nino and La Nina?
El Nino is the warm phase: equatorial Pacific sea-surface temperatures run unusually warm. La Nina is the cold phase: the same waters run unusually cold. Both are part of the El Nino Southern Oscillation (ENSO) cycle and produce nearly opposite weather impacts across much of the U.S.
Does El Nino cause hurricanes?
El Nino actually suppresses Atlantic hurricane activity. The same atmospheric conditions that produce El Nino also produce stronger upper-level wind shear over the tropical Atlantic, which makes it harder for hurricanes to organize and intensify. The Eastern Pacific hurricane season usually runs more active during El Nino.
What was the strongest El Nino on record?
The 2015-2016 event, with a peak Nino 3.4 sea-surface temperature anomaly near +2.6 degrees C in November 2015. It produced California’s wettest winter in five years, a record-quiet Atlantic hurricane season, and global temperature spikes that made 2016 the warmest year on record at the time.
How does El Nino affect winter weather in the Northeast?
Warmer and drier than average. The northern jet stream, which normally delivers winter cold, weakens or shifts farther north during El Nino. Snow accumulation in upstate New York, New England, and the Mid-Atlantic typically runs below normal. Heating fuel demand is lower than during a typical winter.


Jaime McLeod
Jaime McLeod is a longtime journalist who has written for a wide variety of newspapers, magazines, and websites, including MTV.com. She enjoys the outdoors, growing and eating organic food, and is interested in all aspects of natural wellness.
- Jaime McLeod

- Jaime McLeod
- Jaime McLeod
- Jaime McLeod